 Aguas Calientes City Guide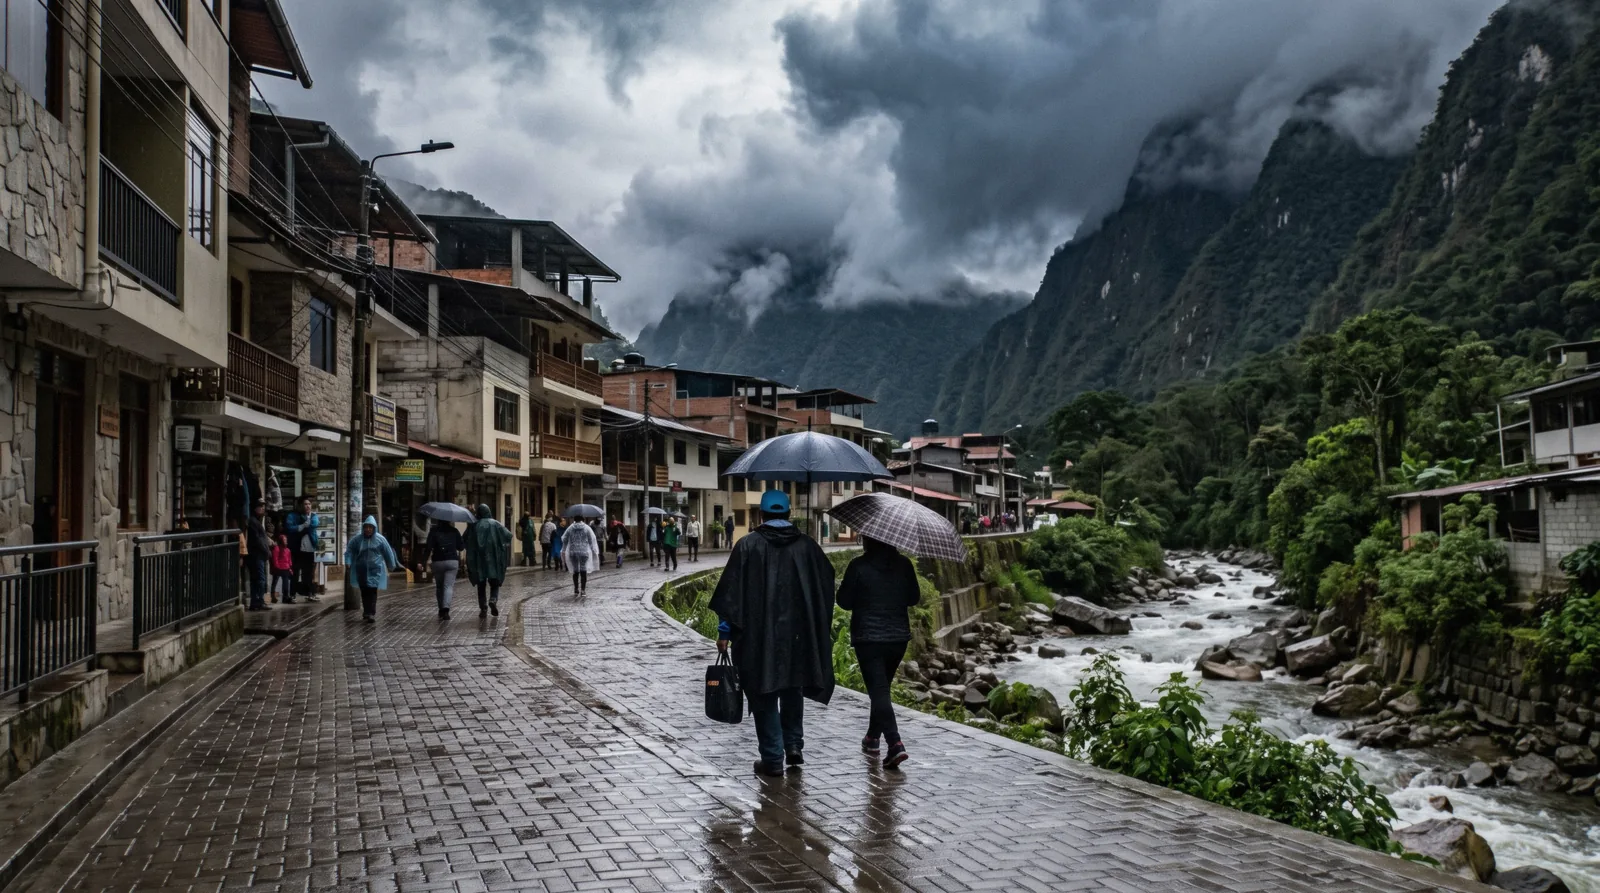
Aguas Calientes Weather: Temperatures, Rain and Rainy Days by Month
Aguas Calientes weather has one defining trait. The town sits at about 2,040 m in the Urubamba gorge below Machu Picchu, and temperature barely moves all year. Average highs across the twelve months run from 19.7C to 21.1C, so the town you stand in is warm in every season. Rain is the real variable, and it swings hard, from 47.1 mm in July to 270.6 mm in December, with an annual total of roughly 2,015 mm. One caveat before any of the numbers. This page's climate figures come from an ERA5 model grid cell, a coarse reanalysis covering the area at about 25 km resolution for 1995 to 2024, not from a thermometer in the town plaza. A grid average can differ sharply from what falls inside a steep gorge, especially during short convective afternoon showers. Use the table as a pattern, not a forecast. If you are weighing seasons against each other, the wider comparison lives in best time to visit Machu Picchu, and the thinner air question is covered on our altitude page. This page stays narrow, the month-by-month numbers and what they mean on the ground.
Quick answer How warm is Aguas Calientes and when does it rain?
Aguas Calientes weather stays warm all year, with average highs between 19.7C and 21.1C. The wet season runs November to March, peaking in December at 270.6 mm of rain. July is driest at 47.1 mm.
Key takeaways
- Average high temperatures only range from 19.7C in June and July to 21.1C in October, so season choice is about rain, not heat or cold.
- June, July and August form the dry stretch, with June averaging 52.5 mm and July 47.1 mm of rain.
- There is no station reading for this valley in our sources. All figures here are ERA5 model grid data for 1995 to 2024, and real showers in the gorge can be sharper than the grid average.
- See what rain does not close in our things to do in Aguas Calientes guide, and budget the wet months with our costs breakdown.
Aguas Calientes Temperature and Rain by Month
These figures come from the ERA5 reanalysis, a coarse model grid cell of roughly 25 km resolution covering Aguas Calientes for 1995 to 2024. It is not a ground station reading. No station-based climate normal for this valley was found in our sources, and the gorge's real local rainfall, especially convective afternoon showers, can differ sharply from the grid average. Read the chart as a long-term pattern. Daily highs in the model sit in a band of about 19.7C to 21.1C year round. The visible movement is in the rain bars, which climb from a low of 47.1 mm in July to a peak of 270.6 mm in December.
July is the driest month at 47.1 mm and December is the wettest by volume at 270.6 mm. For how those two stretches compare for a visit, see best time to visit Machu Picchu.
Rainfall and Rainy Days, Month by Month
This is the literal weather in Aguas Calientes by month, the raw numbers behind the pattern. A rainy day here counts as any day with at least 1 mm of rain. Two things stand out immediately. First, the rainy-season months have 30 or more rainy days out of a possible 31, which in a model grid cell means rain is near-constant rather than concentrated in a few storms. Second, even the driest month still averages more than 13 rainy days, so a fully dry day is never guaranteed in any season. As before, these are ERA5 model grid cell values for 1995 to 2024, not station readings, and the canyon effect can push real local totals above or below these figures on any given day.
| Month | Rain | Rainy Days |
|---|---|---|
| January | 296.0 mm | 30.7 |
| February | 266.2 mm | 28.0 |
| March | 253.1 mm | 30.6 |
| April | 175.0 mm | 28.1 |
| May | 88.7 mm | 21.7 |
| June | 52.5 mm | 15.1 |
| July | 47.1 mm | 13.1 |
| August | 66.3 mm | 17.2 |
| September | 107.4 mm | 23.6 |
| October | 171.2 mm | 28.8 |
| November | 221.3 mm | 29.3 |
| December | 270.6 mm | 30.5 |
Figures current in Q3 2026.
What the Numbers Mean on the Ground
Monthly averages hide the texture of a day in the gorge. These three reads turn the table above into practical expectations, from what the dry stretch actually feels like to why you should never expect a cold night here.
The Driest Stretch, June to August
June averages 52.5 mm of rain over 15.1 rainy days, July 47.1 mm over 13.1 rainy days, and August 66.3 mm over 17.2 rainy days. Even in the driest month, the model still records rain on more than 13 days out of 31, which tells you the honest baseline: drizzle and light showers are normal here in any season. What changes is the intensity and the total volume.
July's 47.1 mm is roughly one sixth of December's 270.6 mm, so dry-season rain tends to pass quickly rather than settle in. Mornings are the most reliable dry window, which matters because the timed entry system gives you a fixed slot and a standard stay of 2h30m at the citadel. Nights in these months are the coolest of the year, with model lows of 11.6C in June and 11.0C in July, about 53F and 52F.
That is a light layer, not a winter coat. Pack for the showers anyway, because the gorge generates its own cloud.
The Wettest Stretch, November to January
The model shows November at 221.3 mm, December at 270.6 mm and January at 296.0 mm, with rainy days at 29.3, 30.5 and 30.7 respectively. In practical terms, rain on any given day in these months is close to a coin flip weighted heavily toward yes, and the rainfall that does fall is heavy. February stays nearly as wet at 266.2 mm over 28.0 rainy days, and March eases only slightly to 253.1 mm.
The Inca Trail closes every February for maintenance and cleaning, a closure sourced via Wikipedia, which tells you how seriously the wet season is taken operationally. SERNANP defines the rainy season as November to March and recommends April to October instead. The town itself keeps working through all of it.
Buses still run the switchback road, restaurants stay open and covered walkways handle most of the water. The practical consequence is simple, schedule indoor slack into wet-season days, start with the earliest entry slot you can get, and treat a dry afternoon as a bonus rather than a plan.
Why the Temperature Barely Moves
The average high across all twelve months sits between 19.7C and 21.1C, a spread of just 1.4C. The reason is geography. Aguas Calientes sits at about 2,040 m at the bottom of the Urubamba gorge, close to the equator, so day length and sun angle change little through the year and the deep valley walls trap warm, humid air.
The effect of season shows up mostly in overnight lows, which drift from about 11.0C in July to 14.5C in February. SERNANP's own notes make the elevation gradient clear: around the archaeological site expect 14.5C to 16.5C, on the Inca Trail 5C to 18C, and above 4,350 m just 1.5C to 3C. The town is the warmest point in that chain.
So if you arrive from Cusco at about 3,399 m, the gorge feels noticeably milder, and packing that worked at altitude may feel too warm here. Layers you can shed and stow beat a single heavy jacket, especially since a rain shell is doing double duty in most months.
What the Weather Decides Day to Day
Beyond the monthly table, weather in the gorge shapes specific decisions: what goes in your bag, what the river is doing at the bottom of town, and where a trustworthy forecast actually comes from.
Packing for the Gorge
The rain numbers settle the packing list. With an annual total near 2,015 mm and no month below 47.1 mm, a rain shell or compact umbrella belongs in the bag in every month, not just the wet season. Daytime warmth of 19.7C to 21.1C average highs means breathable clothing works, and a single warm layer covers the coolest evenings, which drop to model lows of about 11.0C in July.
Footwear matters more than in most warm towns, because wet stone and the steep stairs that run through Aguas Calientes get slippery fast. Grip soles beat sandals in any month. If your entry slot is early, remember the hourly slots run 06:00 to 15:00 and regular tickets allow a 30-minute arrival tolerance, so check the sky before you commit to walking up rather than taking the bus.
If heavy rain strands you mid-itinerary, luggage storage in town is covered on our luggage storage page, and wet-day options are on our rainy day guide.
The River, and What Is Not Published
The Vilcanota, also called the Urubamba, runs straight through the gorge past the town, and in the wet months it runs high, brown and loud. It is the single most visible sign of the rain totals in the table above. Here is the honest negative finding: in our research pass we did not find an official flood-risk or water-level page published for the town specifically.
The one regional flood event our sources corroborate is from January 2010, reported by the press, and it was regional rather than isolated to Aguas Calientes. We will not invent a flood frequency or a casualty figure for the town, because none of our sources support one. What this means practically is that you should treat river levels the way locals do, by looking at them.
Hotels and operators in town watch the water daily during the heavy months and adjust advice accordingly. If conditions look severe, the sensible move is to ask your hotel that morning rather than rely on any published gauge, because no reliable public one was found for this stretch of the river.
Where Real Forecasts Come From
Every figure on this page is a long-term average, so for your actual travel dates you need a forecast. SENAMHI is Peru's national weather and hydrology service and it runs a tourist-forecast portal at senamhi.gob.pe. We state plainly what our research found: no SENAMHI station-based climate normal for the Aguas Calientes or Machu Picchu valley was located in this pass, and we will not invent one.
That is exactly why this page uses the ERA5 reanalysis instead, a model grid cell of roughly 25 km resolution covering 1995 to 2024. The distinction matters. A station reads one real point in the gorge.
A grid cell averages a wide area of mountains and valleys, which smooths out exactly the convective afternoon showers this terrain is known for, so real rainfall at any given moment can differ sharply from the numbers above. For a day-by-day picture, check a short-range forecast close to your date and treat this page as the pattern that forecast sits inside.
Weather-Proof Bookings
Rain changes timing more than plans, so the two bookings that matter most are the ones with fixed entry times. Our own ticket prices for a visit are US$43.00 for the entrance card and US$19.00 for the bus card.
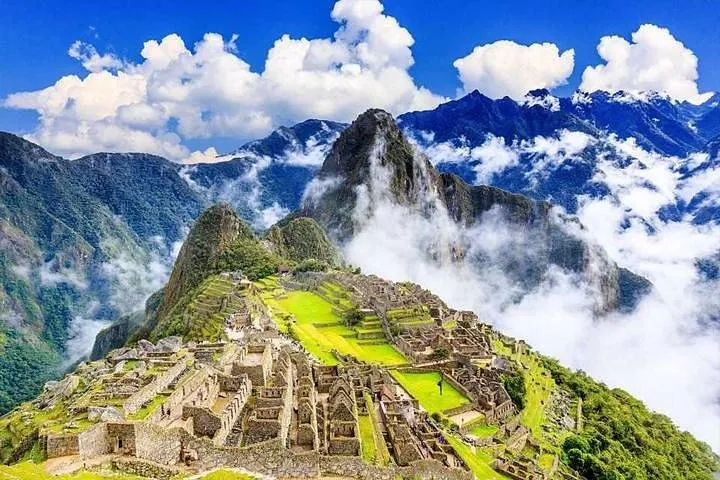 from $43.00
Machu Picchu Entrance Ticket
MachuPicchu.Center sells the official entrance ticket alone for the circuit you choose, with the private guide and bus only bundled in on the separate 2-day Circuit 2 commitment option. All sales are final, so double-check your date and circuit before paying.
Check Availability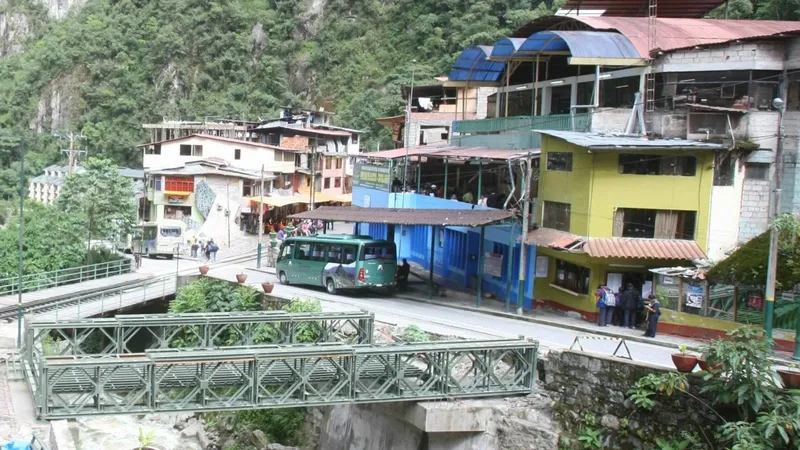 from $19.00
Aguas Calientes: Bus Transfer to Machu Picchu Citadel
Peru & U's local partner reserves your one-way or round-trip bus ticket between Aguas Calientes and the Machu Picchu citadel gate and emails it to you, skipping the ticket-booth line in town. It's non-refundable once booked, so pick your date carefully.
Check AvailabilityPrices, ratings and details are the platform's own. Dollar figures are the listed prices. The platform bills in your account's currency.
Aguas Calientes Weather Questions
What is the weather like in Aguas Calientes, Peru?
Warm and wet. The town sits at about 2,040 m in the Urubamba gorge, and average highs only range from 19.7C to 21.1C across the whole year. Rain is the variable. Annual totals run near 2,015 mm, from 47.1 mm in July to 296.0 mm in January on the ERA5 model grid. Nights are mild, with the coolest model low about 11.0C in July. Note these are model grid figures for 1995 to 2024, not station readings, and real showers in the gorge can be sharper than the grid average.
When is the weather in Aguas Calientes at its best?
By the raw numbers, the driest stretch is June to August, with July the single driest month at 47.1 mm of rain over an average of 13.1 rainy days. June sits close behind at 52.5 mm. Even then, rain on roughly half the days of the month is normal, so no month is reliably dry. SERNANP recommends April to October and defines the rainy season as November to March. The trade-off between dry skies and higher visitor numbers is covered on our best time page.
Does it rain every day in Aguas Calientes?
In the wet season, effectively yes. November through March average between 28.0 and 30.7 rainy days per month on the ERA5 grid, meaning rain of at least 1 mm falls on nearly every day. Even in July, the driest month, the average is 13.1 rainy days. The practical pattern is often a dry or clearer morning with shower activity building later, so early entry slots are the safest bet. These are 30-year model averages, and the gorge's local shower pattern can differ from the grid cell.
What should I pack for Aguas Calientes weather?
A rain shell or compact umbrella in every month, since no month averages below 47.1 mm of rain. Add breathable clothing for daytime highs around 20C to 21C, one warm layer for evenings that can drop to about 11C in the dry months, and footwear with real grip for wet stone stairs and paths. A small dry bag or waterproof cover for electronics is worth it in the November to March stretch, when monthly totals exceed 220 mm.
How different is Machu Picchu weather from the town below?
The citadel sits higher, at about 2,430 m at the gate, and SERNANP puts temperatures around the archaeological site at 14.5C to 16.5C, cooler than the town in the gorge. The rain pattern is broadly the same, since the two sit a few kilometers apart in the same valley system, so wet and dry seasons line up. The practical difference is exposure. The citadel terraces catch wind and cloud that the canyon walls block, so conditions at the top can feel cooler and wetter than the warm air you left in town.
Prices, hours and terms are set by the venue or operator and confirmed at checkout.
We may earn a commission if you book through one of our links, at no extra cost to you. Full affiliate disclosure